
Data Visualizations
1 articleA useful Data Visualizations archive explains benchmarks, surveys, datasets, methodology notes, trend reports, charts, rankings and evidence-based explainers through stories people can act on or remember. It should combine current updates with enough background to make the subject easier to revisit.
Strong coverage can combine licensing questions, migration notes, pricing changes, case studies and workflow examples. The goal is to make the subject useful for both quick reading and deeper research into related questions.
The section gains depth through links with Benchmark Reports, Original Research, Survey Reports, Dataset Articles. Those relationships let visitors compare causes, consequences and practical choices across the site.
Strong coverage can combine licensing questions, migration notes, pricing changes, case studies and workflow examples. The goal is to make the subject useful for both quick reading and deeper research into related questions.
The section gains depth through links with Benchmark Reports, Original Research, Survey Reports, Dataset Articles. Those relationships let visitors compare causes, consequences and practical choices across the site.
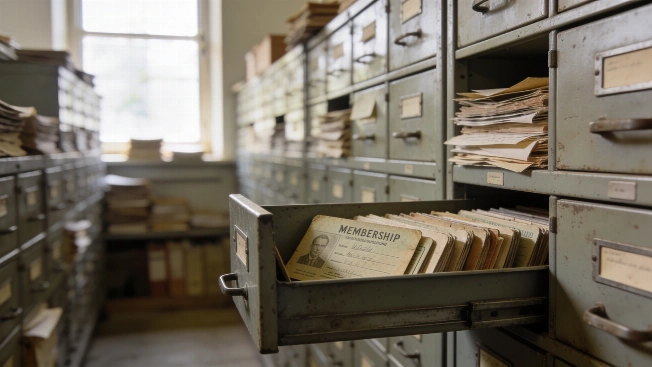
Die Zeit Uses AI to Make Nazi Party Records Searchable
Millions of Nazi Party membership cards are now searchable online. Die Zeit’s AI-powered project lets users uncover hidden family histories. The database has drawn millions of searches and global attention.