
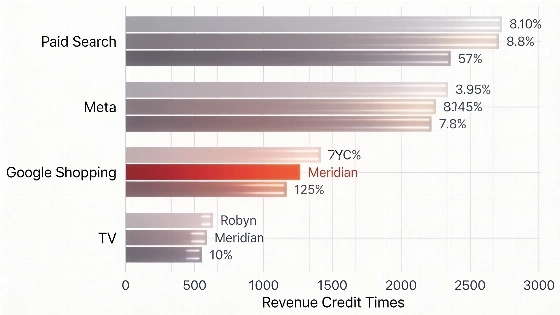
When three marketing mix models disagree about where to put millions in ad spend, the risk isn’t just a bad chart-it’s a budget mistake that goes unnoticed until the money is gone. In a recent synthetic case, Robyn credited paid search with 41% of revenue, while Meridian and PyMC-Marketing put that figure at 22% and 19%. The gap comes down to each model’s assumptions about decay, saturation, and causality, which can completely change the story behind the same data.
Google’s Meridian leverages a JAX backend and requires GPU-enabled environments, reflecting a shift toward modern, scalable technical stacks for MMM workflows.
Every MMM brings its own perspective. Adstock and decay windows decide how long a channel’s effect lasts. Saturation curves determine how quickly returns drop off, shaping every reallocation. Bayesian priors and regularization set the range for plausible effect sizes, while seasonality and control variables decide whether a spike is credited to the calendar or the channel. Change any of these, and the same spend history leads to a different answer.
Model mechanics
Robyn, Meta’s open-source tool, runs on R and uses ridge regression with evolutionary hyperparameter search. It’s fast and accessible, so many marketing teams use it as a baseline. Meridian, from Google, is Python-based, Bayesian, and geographically hierarchical-well-suited for brands with regional spend variation and upper-funnel effects. According to independent technical coverage, Meridian estimates incremental contribution, ROI, and response curves from aggregated data using geo-level hierarchical Bayesian regression, adstock, and Hill saturation functions. PyMC-Marketing, also Python-based, offers full Bayesian flexibility, letting analysts define priors and indirect-effect paths between channels. Each tool has its strengths and blind spots, and all are limited by the data they use.
The Meridian demo documentation outlines an end-to-end MMM pipeline, including data loading, model configuration, diagnostics, results generation, budget optimization, and scenario planning, positioning the tool for allocation decisions rather than just reporting.
Fit statistics like R² can be tempting, but they only show how well a model fits the past-not whether its causal story is right. The real test is whether channel decompositions and response curves agree across models. When they do, the recommendation is solid. When they don’t, the uncertainty is visible and actionable before it turns into a budget error.
Pinpointing disagreement
Model disagreement isn’t random. Channel collinearity-when two channels scale together-forces models to split credit in different ways. Seasonal confounds let a channel absorb calendar-driven lift if controls are weak. Flat spend histories leave models guessing at saturation based on their formulas, not the data. Adstock window sensitivity can hide or exaggerate slow-building effects. Data gaps and tracking breaks often show up as regional or time-based oddities in model outputs.
In the DTC brand example, Meta and Google Shopping always scaled together during peak season. Each model split their combined 40% share differently-24%/11%, 31%/9%, 18%/22%-with no way to recover the true allocation from observation alone. Only targeted experiments can break these deadlocks.
Common patterns include seasonal credit swings, small channels flipping sign between models, and halo effects where upper-funnel video boosts search performance in models that allow indirect paths. Sometimes, all three models agree on an uncomfortable truth: a long-favored channel is underperforming, and the data makes it impossible to ignore.
From comparison to action
Comparing MMMs isn’t just academic. It’s a practical way to avoid costly mistakes. When models agree, you can move budget with confidence. When they diverge, the biggest gaps become the next targets for geographic lift or holdout tests. One or two focused experiments can resolve more uncertainty than months of scattered testing.
In practice, this means building a single dataset with at least two years of weekly history, running Robyn as a baseline, then adding Meridian or PyMC-Marketing for a genuinely different second opinion. Compare decompositions and response curves, not just fit stats. Track where models agree and where they don’t. Plan one geographic test to address the largest gap, then use the result as a prior for the next model run. The disagreement should shrink on rerun, tightening the evidence for future decisions.
For teams defending budgets as AI-driven search and attribution shift, this approach is essential. As outlined in Google’s September 2026 blog post, Meridian’s recent upgrades focus on using brand signals and "real-world causal proof" to connect upper-funnel campaigns to future sales, reflecting a broader industry push for stronger causal calibration. Static forecasts and single-model thinking are risky when search behavior and platform algorithms can change overnight. Only by surfacing and resolving uncertainty can marketers avoid being blindsided by their own tools.
Relying on a single MMM is a gamble with stakes that often reach six or seven figures. The only way to expose hidden assumptions and surface actionable uncertainty is to run multiple models, compare their outputs, and let the points of disagreement drive targeted testing. This isn’t about averaging opinions-it’s about building a chain of evidence that leadership can trust when real money is at stake. Teams that treat model disagreement as a roadmap, not a nuisance, will make smarter, faster, and more defensible budget decisions as the ground keeps shifting.
Meta, the company behind Robyn, reported $134 billion in ad revenue in 2025, making it the world’s largest digital advertising platform. Google, developer of Meridian, generated $237 billion in ad revenue the same year. Both companies have invested heavily in open-source MMM tools to shape how brands allocate billions in global ad spend, showing just how high the stakes are for getting these models right.